Work that's safer
Sanitation and informal-sector workers brought into our operations get PPE, training and regular pay.
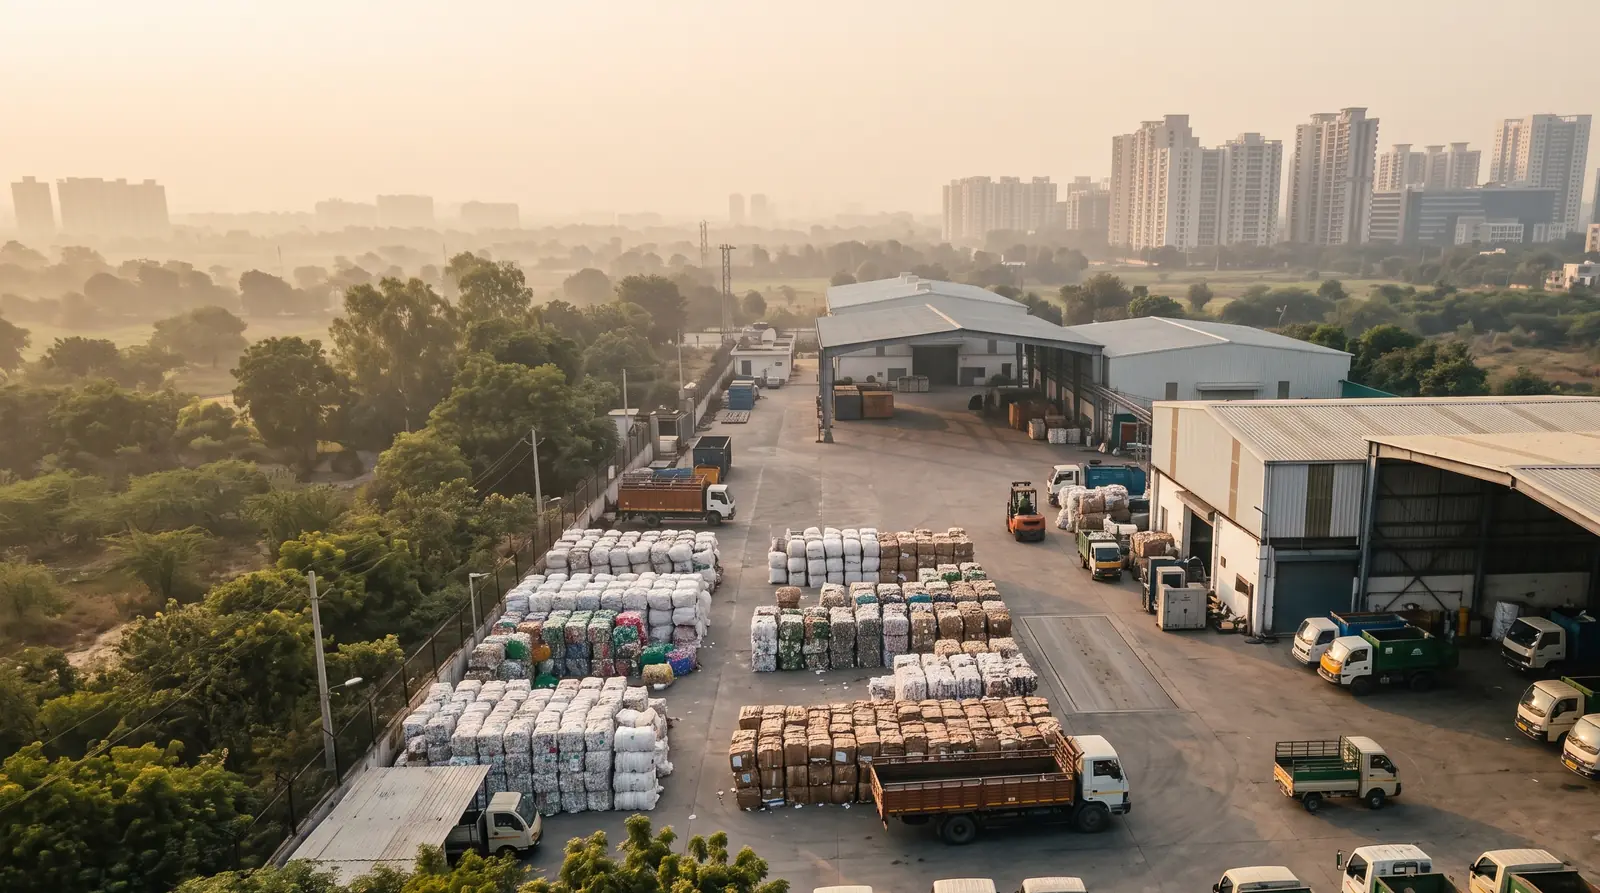
Anyone can say they're sustainable. We'd rather show you the weighbridge slip. These are the volumes we've handled since 2017, and what they add up to.
Measured volumes, from our weighbridge records to July 2026.
Calculated from the measured volumes using published emission factors. The factors are listed below so anyone can check the maths.
| Recycled plastic | 4,400 t × 1.5 t CO₂e per tonne = 6,600 t CO₂e. Emissions avoided by replacing virgin polymer; conservative against PlasticsEurope eco-profiles for PE and PP (about 1.6 to 1.9 kg CO₂e/kg). |
|---|---|
| Landfill methane avoided | 3,500 t × 0.5 t CO₂e per tonne = 1,750 t CO₂e. Methane that residual waste would have generated in landfill, in line with the IPCC waste model and UK Government (DESNZ) landfill conversion factors. |
| Energy recovered | 3,500 t × 15 MJ/kg = 52,500 GJ ≈ 14,600 MWh (thermal). 15 MJ/kg is a typical net calorific value for refuse-derived fuel used in Indian cement kilns. |
| Coal replaced | 52,500 GJ ÷ 16.7 GJ per tonne ≈ 3,100 t of Indian non-coking coal (about 4,000 kcal/kg). |
| Landfill space | (4,400 t + 3,500 t) ÷ 0.85 t/m³ ≈ 9,300 m³ at typical compacted landfill density. |
| Car equivalent | 8,350 t CO₂e ÷ 4.6 t per car per year ≈ 1,800 cars, using the US EPA greenhouse gas equivalency figure. |
Measured volumes are to July 2026. Derived figures are rounded and deliberately conservative: we don't count emissions from fossil fuels displaced in the kiln, or the cement Plave replaces. We'll recalculate as new data comes in.
Enter the area you plan to pave with Plave. The results use the upper-bound catalogue figures per square metre, so treat them as a ceiling, not a promise.
A number is only as good as the record under it. These are the four points where we capture one.
Every load is weighed and logged against the ward, plant or site it came from.
Weighed again at our facility, so losses in transit show up.
Recovered fractions and fuel are weighed out to named recyclers and processors, with receipts.
Plastic going into Plave and GeoBlocks is recorded batch by batch.
Sanitation and informal-sector workers brought into our operations get PPE, training and regular pay.
Scheduled collection removes the open dumps that form when pickup is unreliable.
Multilayer wrappers have almost no buyer. Plave gives them one, which makes collecting them worthwhile.
Plave calculator figures are upper bounds from the Dump In Bin Pre-Cast Catalog 2025: up to 24 kg CO₂e and 21 litres of fresh water saved, and up to 125 kg of recycled material used, per m². Plave's carbon-negative claim is based on internal calculations.